
Second-order
nonlinear interaction of noncollinear propagating broadband laser pulses
Chi2D
and
chi3D
use
the
Euler
method
within
a
split-step
algorithm
to
compute
the
evolution
of
the
2
or
3
dimensional
electrical
fields
containing
pump,
signal
and
idler
pulses.
The
complex
electrical
fields
after
a
linear
propagation
step
are
Fourier
transformed
into
the
spatiotemporal
domain.
A
novel
set
of
coupled
nonlinear
equations
calculate
the
change
in
the
ordinary
and
extra-ordinary
polarized
electrical
fields,
respectively.
The
different
terms
of
the
equations
include
all
possible
second-order
nonlinear
interaction
types
in
one
step.
This
includes
sum
frequency
generation
(SPM),
second
harmonic
generation
(SHG),
difference
frequency
generation
(DFG),
as
well
as
all
thinkable
parasitic
and
cascaded
conversion
processes.
The
phase
of
the
newly
generated
frequency
components
defines
the
constructive
or
deconstructive
interference with the fundamental field and the propagation direction within the next linear propagation step.
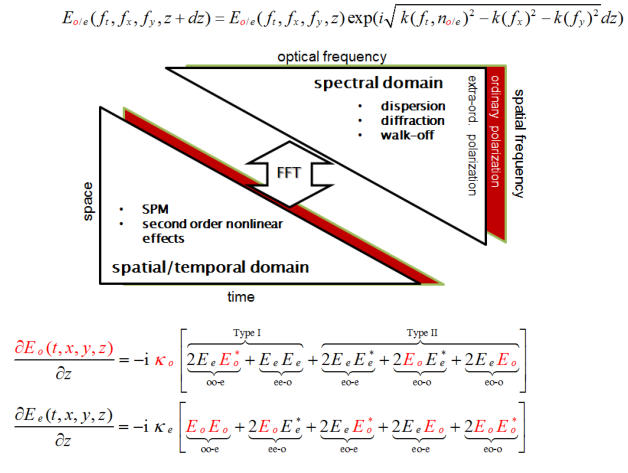
Propagation of ultra-short laser pulses in isotropic and birefringent media
The linear evolution of the arbitary light field containing a super position of all involved fs-laser pulses is realized in Fourier space of the ordinary and extraordinary field. Following a solution of the wave equation, a linear phase given by the Sellmeier formalism is added to the optical and spatial frequency spectrum. The result is the application of dispersion, diffraction and displacement due to walk-off and non-collinear propagation within each propagation step in z direction.
Treatment
of
all
pulses
in
only
two
orthogonal polarized fields
Second
order
nonlinear
frequency
conversion
processes
e.g.
the
second
harmonic
frequency
generation
(SHG),
the
sum
frequency
generation
(SFG)
or
the
difference
frequency
generation
(DFG,
OPG,
OPA,
OPCPA)
are
the
fundamental
concepts
and
part
of
almost
any
modern
high
energy
and
ultra-short pulsed laser system.
Analytical
methods
to
predict
the
efficiency
of
a
certain
conversion
process
is
only
possible
under
defined
circumstances,
e.g.
a
negligible
pump
wave.
The
traditional
way
to
compute
the
parametric
conversion
numerically
is
the
use of the three well known coupled equations,
.Each
equation
describes
the
change
of
the
specific
complex
pump,
signal
and
idler
wave,
respectively.
Consequently
each
phase-matched
nonlinear
process
needs
to
be
implemented
individually.
In
particular
ultra-broadband
optical
parametric

amplifiers
(OPCPA)
are
subject
of
a
variety
of
parasitic
and
cascaded nonlinear processes.
In
contrast,
chi2D
and
chi3d
rely
on
a
new
concept
utilizing
the
fact,
that
all
second
order
conversion
processes
of
practical
use
are
realized
in
birefringent
nonlinear
crystals.
Consequently,
the
superposition
of
all
involved
optical
pulses
(signal,
idler,
pump,
parasitic
and
cascaded
signals,
etc.)
can
be
described
within
only
two
orthogonal
polarized
complex
electrical
fields.
A
novel
set
of
only
two
nonlinear
coupled
equations
dedicated
to
the
ordinary
and
extraordinary
electrical
fields
inherently
include
all
possible
C
²-nonlinear
processes.
Combined
in
a
split-step
Fourier
algorithm
the
linear
propagation
effects,
such
as
diffraction,
dispersion
and
walk-off,
as
well
as
the
relevant
C
³-nonlinear
effects
like
self-
phase
modulation
and
self-focusing
can
be
easily
implemented. [
Lang, et. al., Optics Express
21
(01) (2013)
]
The
example
illustrates
the
spatiotemporal
evolution
of
pump
(green),
signal
(orange)
and
idler
field
(red)
during
a
broadband
non-
collinear
optical
parametric
amplification
process in BBO.
Super fluorescence cone / cascaded frequency generation in chirped pulse
parametric amplifiers
The
following
example
is
taken
from
an
experimental
and
theoretical
study
of
a
double
stage
high
power
OPCPA
system
published
in
Matyschok,
et.
al.,
Optics Express
21
(24) (2013).
The
colorful
photograph
shows
a
screen
illuminated
by
the
well
known
super
fluorescence
cone
visible
in
high
power
OPCPA
systems.
Beside
the
visible
parasitic
idler
and
signal
SHG
or
the
scattered
green
pump
light
passing
through
the
hole
in
the
screen,
a
variety
of
additional
features
emerge
at
different
angles.
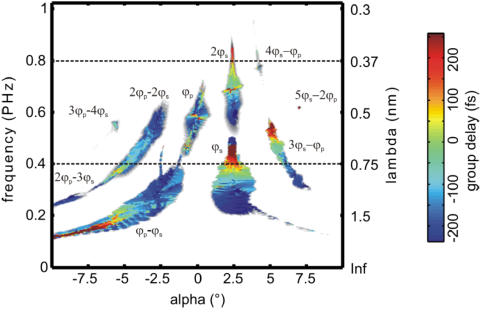
The
animation
illustrates
the
generation
of
the
spectral,
angular
distributions
of
all
visible
and
non-
visible
mixing
products
in
optimum
temporal
overlap
between
pump
and
seed
pulse
as
simulated
with
chi2D.
The
detailed
information
about
the
respective
polarization,
spectrum,
propagation
direction
and
phase
allows
to
address
each
mixing
product
to
its
specific
cascading
path.
It
can
be
seen
that
during
the
amplification
process
the
simulation
reproduces
each
and
every
feature
visible
in
the
photograph
as
taken
of
the
experiment.
Since
the
complex
electrical
fields
contain
the
full
information
regarding
the
spectral
phase,
it
is
possible
to
map
the
relative
group
delay
of
each angular and spectral resolved mixing product.
Having
a
look
on
the
quantitative
agreement
between
experiment
and
simulation
both
subsequential
amplification
stages
of
the
OPCPA
system
were
simulated
using
the
chi2D
code.
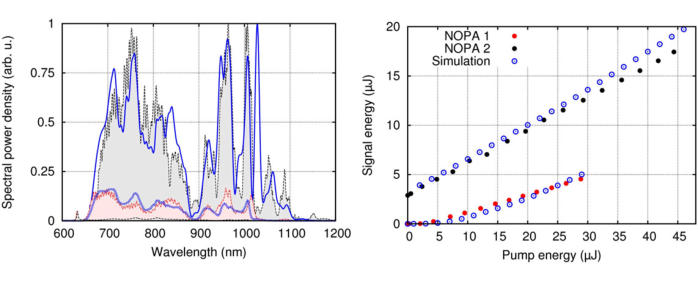
The
two
plots
show
the
comparison
of
simulated
and
experimental
results.
Left:
Measured
spectra
of
the
amplified
signal
pulse
after
the
first
stage
(red
shaded)
and
for
the
further
amplified
signal
pulse
after
the
second
stage
(grey
shaded);
extracted
spectra
from
the
simulation
(blue lines), respectively.
Right:
Measured
and
simulated
pulse
energies
after
the first and the second stage.
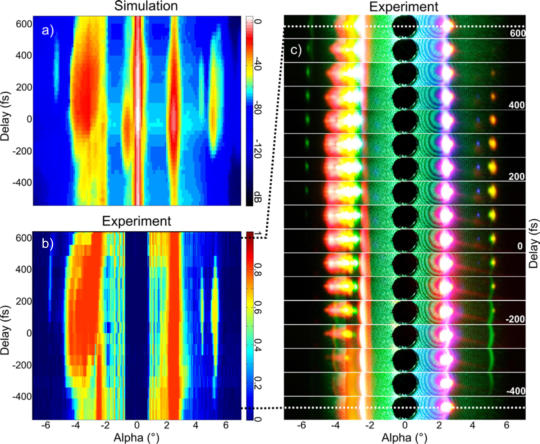
The
previous
results
were
obtained
with
the
optimum
temporal
pump-seed
overlap,
But
also
the
comparison
of
experiment
and
simulation
in
respect
to
the
angular
variation
of
the
intensity
distribution
for
different
intitial
pump-seed
delays
shows
an
excellent agreement.
Figure
(a)
illustrates
the
simulated
angular
power
distribution
for
different
pump-seed
delays
integrated
within
the
visible
spectrum.
The
measured
delay
dependent
spacial
brightness
distribution
is
shown
in
Fig.
(b).
The
map
interpretes
the
respective
center
lines
taken
from
each
photograph
of
the
illuminated
screen
after
the
first
amplification stage in (c).

chi2D
Chi2D is free for scientific use only!
Download


Help
The
chi23D
forum
includes
examples
as
well
as
a
question
&
answer section:
A
simple
starting
guide
named
HowToChi2D
can
be
downloaded in pdf-format:
For more detailed information on the principles, the
correlations and the mechanisms of the nonlinear interaction
of ultrafast light pulses the literature listed is recommented:
chi3D
chi3D
is
a
Matlab
class
based
on
the
same
algorithms
used
in
chi2D
but
can
now
handle
2+1
or
3+1
dimensions.
In
contrast
to
chi2D
it
can
be
called
directly
from
Matlab
similar
to
a
standard
Matlab
toolbox.
This
enables
to
write
scripts
and
simulated
chains
of
nonlinear
conversion
processes,
e.g.
SHG,
DFG,
OPCPA.
Furthermore,
it
is
possible
to
implement
subsequent
components
like
imaging
systems,
delay
plates,
windows
or
a
gas
between
the
stages.
Since
the
complex
electrical
fields
can
be
passed
over
to
each
subsequent
component
in
the
script,
parameter
scans
of
the
whole
system
considering pulse energy, pointing, SPM, etc. are now possible.
In contrast to the free version chi3D is a freelance project and offered on commercial basis together with the support.
Get a free trial version
Dr. Tino Lang
Quälkampsweg 100
D-22880 Wedel
E-mail: info@chi23d.com
Essential Dimensions
tax-ID.: 26/026/53505
contact
Disclaimer
Content
The author reserves the right not to be responsible for the topicality, correctness, completeness or quality of the information provided. Liability claims regarding damage caused by the use of any information provided, including any kind of information which is incomplete or incorrect, will therefore be rejected. All offers are not-binding and without obligation. Parts of the pages or the complete publication including all offers and information might be extended, changed or partly or completely deleted by the author without separate announcement.Referrals and links
The author is not responsible for any contents linked or referred to from his pages - unless he has full knowledge of illegal contents and would be able to prevent the visitors of his site from viewing those pages. If any damage occurs by the use of information presented there, only the author of the respective pages might be liable, not the one who has linked to these pages. Furthermore the author is not liable for any postings or messages published by users of discussion boards, guestbooks or mailinglists provided on his page.Copyright
The author intended not to use any copyrighted material for the publication or, if not possible, to indicate the copyright of the respective object. The copyright for any material created by the author is reserved. Any duplication or use of objects such as images, diagrams, sounds or texts in other electronic or printed publications is not permitted without the author's agreement.Privacy policy
If the opportunity for the input of personal or business data (email addresses, name, addresses) is given, the input of these data takes place voluntarily. The use and payment of all offered services are permitted - if and so far technically possible and reasonable - without specification of any personal data or under specification of anonymized data or an alias. The use of published postal addresses, telephone or fax numbers and email addresses for marketing purposes is prohibited, offenders sending unwanted spam messages will be punished.Legal validity of this disclaimer
This disclaimer is to be regarded as part of the internet publication which you were referred from. If sections or individual terms of this statement are not legal or correct, the content or validity of the other parts remain uninfluenced by this fact.
The data sent will be used only for the
purpose of processing your request.